
This analysis of CDC COVID-19 weekly cases and mortality data spans April – December, 2021. Vaccination status is a statistically significant determinant of mortality outcomes with COVID-19 with the unvaccinated showing consistently higher negative outcomes. This finding is robust to age although the younger the cohort the smaller and less statistically significant the benefits from vaccination. The analysis pays particular attention to Case Fatality Ratios (CFRs) and Deaths per 100,000 between the vaccinated and unvaccinated as well as between the Moderna, J&J’s Janssen, and Pfizer’s vaccine products. CFRs are nearly 1.95x higher among the unvaccinated with both rates below 5%. Mortality rates are over 9x higher among the unvaccinated although for both groups COVID-19 poses less of a threat to their lives than either motor vehicle operation or Influenza. CFRs are higher among Moderna users versus other vaccine products while Deaths per 100,000 are higher among Janssen users. Graphs of critical measures over time are provided.
Intro:
Since COVID-19 was publicly discovered in late December 2019 illness severity and death risks from the virus have been clearly segmented by age, with the oldest more likely to be hospitalized and die from infection. Since March 2020 data from the CDC on patient conditions suggested that pre-existing conditions status and quantity also determined the probability of illness severe enough to require hospitalization. After the emergence of COVID-19 vaccines in 2021 a person’s vaccination status seemed to have a demonstrable impact on mortality risks.
The CDC publishes weekly data on cases and deaths in 2021 with data starting in April, every month. The data segments both cases and deaths by vaccination status, vaccine product type (Janssen, Moderna, Pfizer, or all), and age bracket (12-17, 18-29, 30-49, 50-64, 65-79, 80+, or all adjusted). In light of what is known about COVID-19’s risk profile this data offers insight into who is disproportionately suffering from symptomatic infection and death along age and vaccination deliniations.
Data Exploration
According to the University of North Carolina’s Gillings School of Global Public Health the Case Fatality Ratio is the, “proportion of people recorded as confirmed COVID-19 cases who die from COVID-19.” It can, “be approximated by dividing the number of deaths by the number of confirmed cases.” CFRs are commonly used to measure the lethality of acute infectious disease, which at this point seems to be an appropriate description of COVID-19.
The following are boxplots of Case Fatality Ratios for 2021 COVID-19 CDC data starting with MMWR Week 14, the first week of April. The top graph plots CFRs by vaccine product (categories include “Janssen” fro J&J, “Moderna,” and “Pfizer”) and the bottom graph plots CFRs by vaccination status and age.


The below are similar breakdowns of the weekly CFRs from April – December of 2021. Also included are weekly cases per 100,000 for the same time period. For reference 1,000 cases would be equivalent to a 1% weekly case rate. Notably Moderna’s CFRs remain elevated above all other vaccines for most of the year.


Deaths per 100,000 is a practical way to express the raw mortality rate of a disease. Mortality rates normalize comparisons of lethality between groups by controlling for the difference between the size of the populations exposed. Because of the low digits typically associated with measuring particular disease mortality in large populations a figure like 100,000 is used as the base population comparison. For reference, 1000 deaths per 100,000 would be equivalent to a 1% death rate. As practical references according to the CDC in 2020 there were 14.7 deaths per 100,000 Americans from motor vehicle traffic with an annual average rate of 14 between 2015 and 2020, and Influenza and Pneumonia had a rate of 19.8 in 2020 with an average of 20.4 between 2015 and 2020.
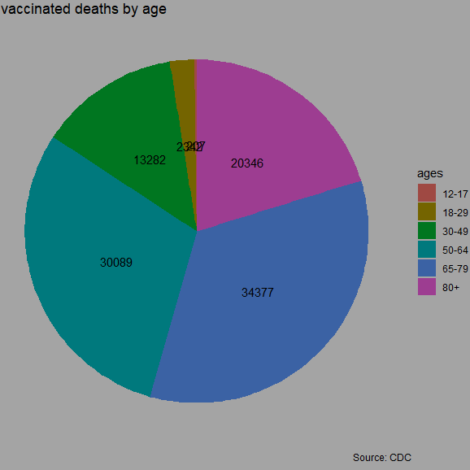
Of the 124,406 killed by COVID-19 in 2021 since vaccination-status tracking by the CDC (according to the CDC as of Jan 21, 2022) just over 19% were vaccinated. The death rate for COVID-19 is arguably the most cited statistic in discussing vaccination status. In this case the death rate is calculated by vaccination status population: the death rate for vaccinated observations is the number of vaccinated deaths divded by the number of vaccinated Americans.
The following are boxplots of Deaths Per 100,000 for most of 2021 (minus the last three weeks) COVID-19 CDC data starting with MMWR Week 14, the first week of April. The top graph plots death rates by vaccine product (categories include “Janssen” from J&J, “Moderna,” and “Pfizer”) and the bottom graph plots death rates by vaccination status and age.


The below are similar breakdowns of the weekly death rates from April – December of 2021.


Are Case Fatality Ratios stable between vaccine products?
Differences in Case Fatality Ratios between vaccine products are important to discerning the effectiveness of any given vaccine product. The CFR distribution from the boxplot in the prior section visually differs between vaccines. Because most of the CFRs are not normally distributed within vaccine types Wilcox tests were conducted to test for statistically significant differences between vaccine types. The results are provided below:
##
##  Wilcoxon signed rank test
##
## data:  jajcfr$Case.fatality.ratio and pfizercfr$Case.fatality.ratio
## V = 324, p-value = 0.8907
## alternative hypothesis: true location shift is not equal to 0
The reults support that J&J’s Janssen and Pfizer’s vaccines have statistically similar CFRs.
##
##  Wilcoxon signed rank test
##
## data:  mdrnacfr$Case.fatality.ratio and pfizercfr$Case.fatality.ratio
## V = 585, p-value = 9.743e-07
## alternative hypothesis: true location shift is not equal to 0
##
## Wilcoxon signed rank test
##
## data: mdrnacfr$Case.fatality.ratio and pfizercfr$Case.fatality.ratio
## V = 585, p-value = 4.871e-07
## alternative hypothesis: true location shift is greater than 0Moderna’s CFR seems to be significantly higher than Pfizer’s.
##
##  Wilcoxon signed rank test
##
## data:  jajcfr$Case.fatality.ratio and mdrnacfr$Case.fatality.ratio
## V = 99, p-value = 0.0002079
## alternative hypothesis: true location shift is not equal to 0
##
## Wilcoxon signed rank test
##
## data: jajcfr$Case.fatality.ratio and mdrnacfr$Case.fatality.ratio
## V = 99, p-value = 0.0001039
## alternative hypothesis: true location shift is less than 0J&J’s Janssen’s CFR is, similarly to Pfizer’s, significantly less than Moderna’s.
Are mortality rates stable between vaccine products?
Differences in mortality rates, similar to case fatality ratios, are important for evaluating vaccine efficacy and seems to matter upon visual inspection of the boxplots.
Moderna and Pfizer’s vaccines have statistically similar mortality rates. Notably though J&J’s Janssen vaccine has mortality rates significantly higher than both its US competitors.
##
##  Paired t-test
##
## data:  subset(vaxdeathrate, Vaccine.product == "Janssen")$Deaths.per.100k and subset(vaxdeathrate, Vaccine.product == "Moderna")$Deaths.per.100k
## t = 6.3343, df = 34, p-value = 3.18e-07
## alternative hypothesis: true difference in means is not equal to 0
## 95 percent confidence interval:
##  0.2925015 0.5688499
## sample estimates:
## mean of the differences
##               0.4306757
##
## Paired t-test
##
## data: subset(vaxdeathrate, Vaccine.product == "Janssen")$Deaths.per.100k and subset(vaxdeathrate, Vaccine.product == "Moderna")$Deaths.per.100k
## t = 6.3343, df = 34, p-value = 1.59e-07
## alternative hypothesis: true difference in means is greater than 0
## 95 percent confidence interval:
## 0.3157082 Inf
## sample estimates:
## mean of the differences
## 0.4306757##
## Paired t-test
##
## data: subset(vaxdeathrate, Vaccine.product == "Pfizer")$Deaths.per.100k and subset(vaxdeathrate, Vaccine.product == "Janssen")$Deaths.per.100k
## t = -9.3683, df = 34, p-value = 6.037e-11
## alternative hypothesis: true difference in means is not equal to 0
## 95 percent confidence interval:
## -0.4559909 -0.2934223
## sample estimates:
## mean of the differences
## -0.3747066##
## Paired t-test
##
## data: subset(vaxdeathrate, Vaccine.product == "Pfizer")$Deaths.per.100k and subset(vaxdeathrate, Vaccine.product == "Janssen")$Deaths.per.100k
## t = -9.3683, df = 34, p-value = 3.018e-11
## alternative hypothesis: true difference in means is less than 0
## 95 percent confidence interval:
## -Inf -0.3070742
## sample estimates:
## mean of the differences
## -0.3747066Janssen has an almost 70% higher death rate than the mRNA vaccines which have about 0.62 to 0.67 deaths per 100,000 vaccinated.
Are Case Fatality Ratios different based on vaccination status within age groups?
There are clear differences over time between CFRs based on vaccination status. Average case fatality ratios in the dataset were nearly twice as high for the unvaccinated who averaged 3.5%. What isn’t as clear visually is whether there are differences in CFRs between every age group, and particularly those below 50.
The difference between vaccinated and unvaccinated CFRs is statistically significant, the results are below.
##
##  Paired t-test
##
## data:  unvaxcasefatalityratio$Case.fatality.ratio and vaxcasefatalityratio$Case.fatality.ratio
## t = 9.851, df = 349, p-value < 2.2e-16
## alternative hypothesis: true difference in means is not equal to 0
## 95 percent confidence interval:
##  0.01344043 0.02014611
## sample estimates:
## mean of the differences
##              0.01679327
So is the difference among 12-17 year olds, with the unvaccinated teen having higher CFRs (results below). The average difference between the CFRs of vaccinated and unvaccinated in this age group though is less than 1% of the difference between the total vaccinated and unvaccinated population though.
##
##  Paired t-test
##
## data:  subset(unvaxcasefatalityratio, Age.group == "12-17")$Case.fatality.ratio and subset(vaxcasefatalityratio, Age.group == "12-17")$Case.fatality.ratio
## t = 2.9534, df = 34, p-value = 0.005666
## alternative hypothesis: true difference in means is not equal to 0
## 95 percent confidence interval:
##  4.301357e-05 2.327967e-04
## sample estimates:
## mean of the differences
##            0.0001379051
Other age groups were not normally distributed and were subjected to a Wilcox test. Each age group demonstrated statistically significant increases in CFRs for the unvaccinated compared to the vaccinated.
Are mortality rates different based on vaccination status within age groups?
Statistically significant differences in mortality rates exist based on vaccination status. The unvaccinated, at 9.6 deaths per 100,000 unvaccinated, have more than a 9 times higher death rate than the vaccinated.
##
##  Paired t-test
##
## data:  unvaxdeathrate$Deaths.per.100k and vaxdeathrate$Deaths.per.100k
## t = 11.355, df = 349, p-value < 2.2e-16
## alternative hypothesis: true difference in means is not equal to 0
## 95 percent confidence interval:
##   7.115645 10.096939
## sample estimates:
## mean of the differences
##                8.606292
This relationship between vaccine status and mortality is significant across ages although the magnitude of the difference rapidly decreases with youth. The difference is less than one death per 100,000 between vaccinated and unvaccinated under 29. Deaths within both populations are concentrated among people over the age of 50.
Discussion and further analysis
Vaccination status is a clear determinant of COVID-19 mortality risk, whether measured as a death rate or case fatality ratio. But the typical risk faced by an American in 2021 from COVID-19 was smaller than that posed by motor vehicles or influenza in any given year, including for most of the unvaccinated population.
Vaccination protection was especially small for the youngest age group, mostly due to how small the risk is to this age.To a modestly lesser extent similar could be said for age groups under 50: COVID wasn’t a non-existent threat in 2021 but the threat was not so lethal or widespread that vaccination alone could be said to have made a “dangerous” activity “safe.” Still, to explain the relatively few deaths that happened among both vaccinated and unvaccinated populations more needs to be understood about the demographics and medical history of those sick enough to require hospitalization.
Age is clearly a determining factor in mortality risk for this and many other viral infections. For those over 50 vaccination in general brought safety to the at-risk. Further, COVID-19 was so dangerous for the elderly that they were overrepresented among deaths even after vaccination.
Unfortunately the CDC did not provide vaccine product data segmented by age, future analysis with that data could determine if age interacts with vaccine product types to produce unstable case fatality ratios or mortality rates. There is evidence supporting higher rates of myocarditis from the mRNA vaccines in males under 40. It is possible that the higher CFR associated with the Moderna vaccine in the US could be connected to observations from that UK study. Sex identification would illuminate more about the interactions that could exist with vaccination status or vaccine product type affecting CFRs and mortality outcomes.
Cases in this analysis should be assumed to be wrong and likely to be higher in the real world population. Cases are likely distributed on the basis of case severity with severe infections more likely to trigger test-seeking behavio and case confirmation. As such these CFRs should be assumed inflated compared to the real world.
Future analysis should look at patient data to determine what differentiates the fewer than one percent of the population who die from COVID-19 beyond age. While this analysis can demonstrate the protective effects of vaccination it is unable to clearly predict who is more likely to die, vaccinated or not.
This analysis was conducted in R. You can find the backup code here, on my GitHub.